Writing Queries in ClickHouse using GitHub Data
This dataset contains all of the commits and changes for the ClickHouse repository. It can be generated using the native git-import tool distributed with ClickHouse.
The generated data provides a tsv file for each of the following tables:
commits- commits with statistics.file_changes- files changed in every commit with the info about the change and statistics.line_changes- every changed line in every changed file in every commit with full info about the line and the information about the previous change of this line.
As of November 8th, 2022, each TSV is approximately the following size and number of rows:
commits- 7.8M - 266,051 rowsfile_changes- 53M - 266,051 rowsline_changes- 2.7G - 7,535,157 rows
Generating the data
This is optional. We distribute the data freely - see Downloading and inserting the data.
This will take around 3 minutes (as of November 8th 2022 on a MacBook Pro 2021) to complete for the ClickHouse repository.
A full list of available options can be obtained from the tools native help.
This help also provides the DDL for each of the above tables e.g.
These queries should work on any repository. Feel free to explore and report your findings Some guidelines with respect to execution times (as of November 2022):
- Linux -
~/clickhouse git-import- 160 mins
Downloading and inserting the data
The following data can be used to reproduce a working environment. Alternatively, this dataset is available in play.clickhouse.com - see Queries for further details.
Generated files for the following repositories can be found below:
- ClickHouse (Nov 8th 2022)
- https://datasets-documentation.s3.amazonaws.com/github/commits/clickhouse/commits.tsv.xz - 2.5 MB
- https://datasets-documentation.s3.amazonaws.com/github/commits/clickhouse/file_changes.tsv.xz - 4.5MB
- https://datasets-documentation.s3.amazonaws.com/github/commits/clickhouse/line_changes.tsv.xz - 127.4 MB
- Linux (Nov 8th 2022)
To insert this data, prepare the database by executing the following queries:
Insert the data using INSERT INTO SELECT and the s3 function. For example, below, we insert the ClickHouse files into each of their respective tables:
commits
file_changes
line_changes
Queries
The tool suggests several queries via its help output. We have answered these in addition to some additional supplementary questions of interest. These queries are of approximately increasing complexity vs. the tool's arbitrary order.
This dataset is available in play.clickhouse.com in the git_clickhouse databases. We provide a link to this environment for all queries, adapting the database name as required. Note that play results may vary from the those presented here due to differences in time of data collection.
History of a single file
The simplest of queries. Here we look at all commit messages for the StorageReplicatedMergeTree.cpp. Since these are likely more interesting, we sort by the most recent messages first.
We can also review the line changes, excluding renames i.e. we won't show changes before a rename event when the file existed under a different name:
Note a more complex variant of this query exists where we find the line-by-line commit history of a file considering renames.
Find the current active files
This is important for later analysis when we only want to consider the current files in the repository. We estimate this set as the files which haven't been renamed or deleted (and then re-added/re-named).
Note there appears to have been a broken commit history in relation to files under the dbms, libs, tests/testflows/ directories during their renames. We also thus exclude these.
Note that this allows for files to be renamed and then re-renamed to their original values. First we aggregate old_path for a list of deleted files as a result of renaming. We union this with the last operation for every path. Finally, we filter this list to those where the final event is not a Delete.
Note that we skipped import of several directories during import i.e.
--skip-paths 'generated\.cpp|^(contrib|docs?|website|libs/(libcityhash|liblz4|libdivide|libvectorclass|libdouble-conversion|libcpuid|libzstd|libfarmhash|libmetrohash|libpoco|libwidechar_width))/'
Applying this pattern to git list-files, reports 18155.
Our current solution is therefore an estimate of the current files
The difference here is caused by a few factors:
- A rename can occur alongside other modifications to the file. These are listed as separate events in file_changes but with the same time. The
argMaxfunction has no way of distinguishing these - it picks the first value. The natural ordering of the inserts (the only means of knowing the correct order) is not maintained across the union so modified events can be selected. For example, below thesrc/Functions/geometryFromColumn.hfile has several modifications before being renamed tosrc/Functions/geometryConverters.h. Our current solution may pick a Modify event as the latest change causingsrc/Functions/geometryFromColumn.hto be retained.
- Broken commit history - missing delete events. Source and cause TBD.
These differences shouldn't meaningfully impact our analysis. We welcome improved versions of this query.
List files with most modifications
Limiting to current files, we consider the number of modifications to be the sum of deletes and additions.
What day of the week do commits usually occur?
This makes sense with some productivity drop-off on Fridays. Great to see people committing code at weekends! Big thanks to our contributors!
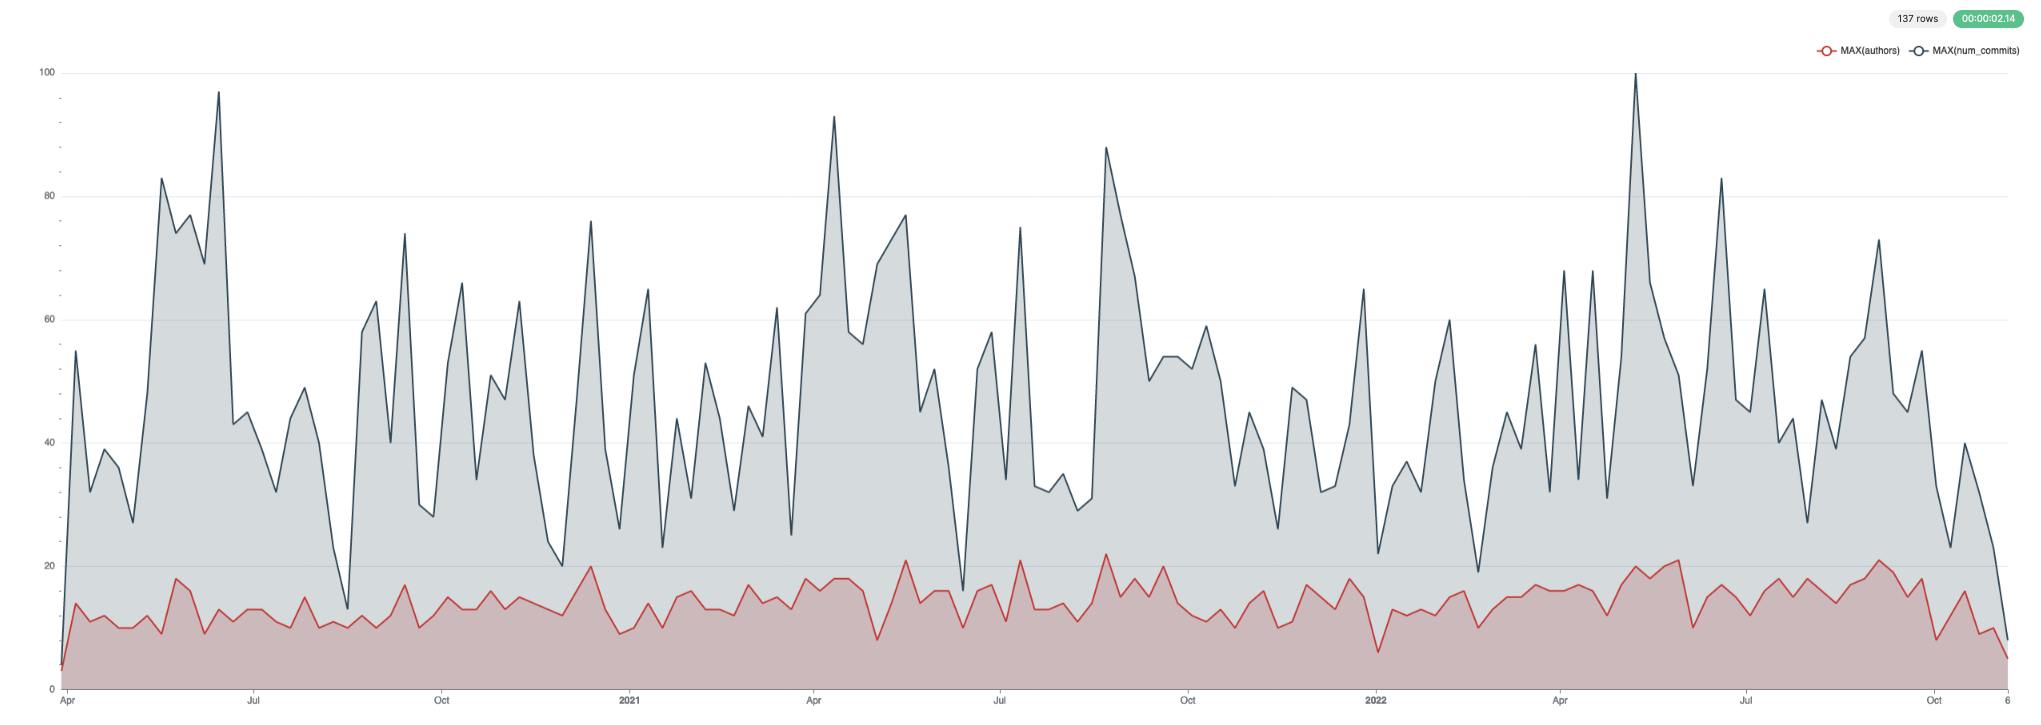
History of subdirectory/file - number of lines, commits and contributors over time
This would produce a large query result that is unrealistic to show or visualize if unfiltered. We, therefore, allow a file or subdirectory to be filtered in the following example. Here we group by week using the toStartOfWeek function - adapt as required.
This data visualizes well. Below we use Superset.
For lines added and deleted:
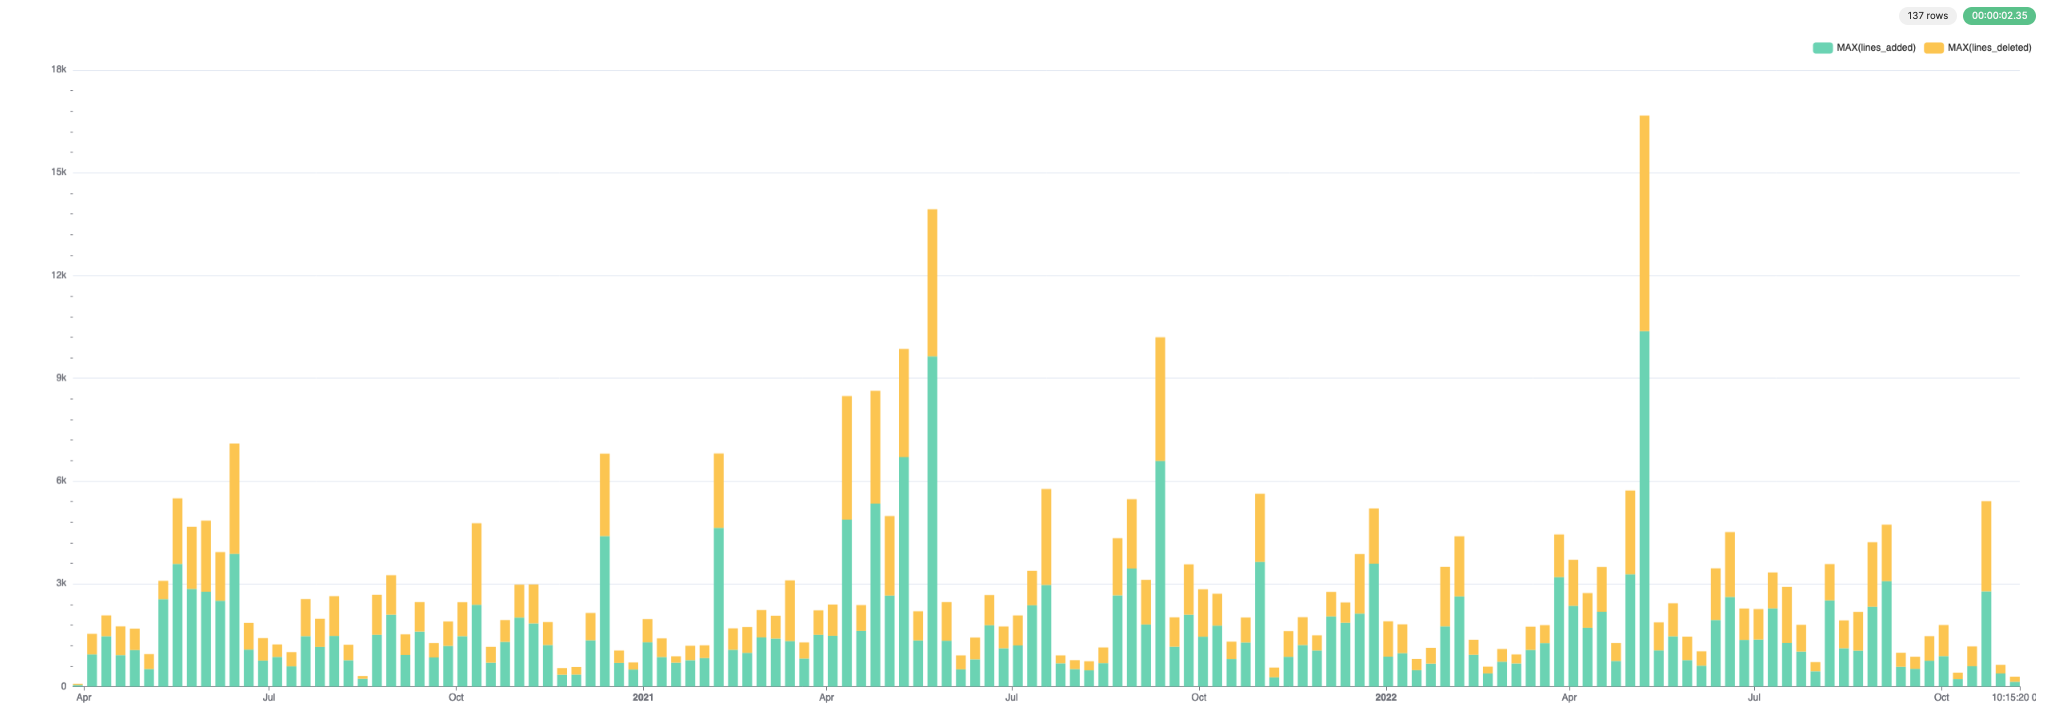
For commits and authors:
List files with maximum number of authors
Limit to current files only.
Oldest lines of code in the repository
Limited to current files only.
Files with longest history
Limited to current files only.
Our core data structure, the Merge Tree, is obviously under constant evolution with a long history of edits!
Distribution of contributors with respect to docs and code over the month
During data capture the changes on the docs/ folder have been filtered out due to a very commit dirty history. The results of this query are therefore not accurate.
Do we write more docs at certain times of the month e.g., around release dates? We can use the countIf function to compute a simple ratio, visualizing the result using the bar function.
Maybe a little more near the end of the month, but overall we keep a good even distribution. Again this is unreliable due to the filtering of the docs filter during data insertion.
Authors with the most diverse impact
We consider diversity here to be the number of unique files an author has contributed to.
Let's see who has the most diverse commits in their recent work. Rather than limit by date, we'll restrict to an author's last N commits (in this case, we've used 3 but feel free to modify):
Favorite files for an author
Here we select our founder Alexey Milovidov and limit our analysis to current files.
This makes sense because Alexey has been responsible for maintaining the Change log. But what if we use the base name of the file to identify his popular files - this allows for renames and should focus on code contributions.
This is maybe more reflective of his areas of interest.
Largest files with lowest number of authors
For this, we first need to identify the largest files. Estimating this via a full file reconstruction, for every file, from the history of commits will be very expensive!
To estimate, assuming we restrict to current files, we sum line additions and subtract deletions. We can then compute a ratio of length to the number of authors.
Text dictionaries aren't maybe realistic, so lets restrict to code only via a file extension filter!
There is some recency bias in this - newer files have fewer opportunities for commits. What about if we restrict to files at least 1 yr old?
Commits and lines of code distribution by time; by weekday, by author; for specific subdirectories
We interpret this as the number of lines added and removed by the day of the week. In this case, we focus on the Functions directory
And by time of day,
This distribution makes sense given most of our development team is in Amsterdam. The bar functions helps us visualize these distributions:
Matrix of authors that shows what authors tends to rewrite another authors code
The sign = -1 indicates a code deletion. We exclude punctuation and the insertion of empty lines.
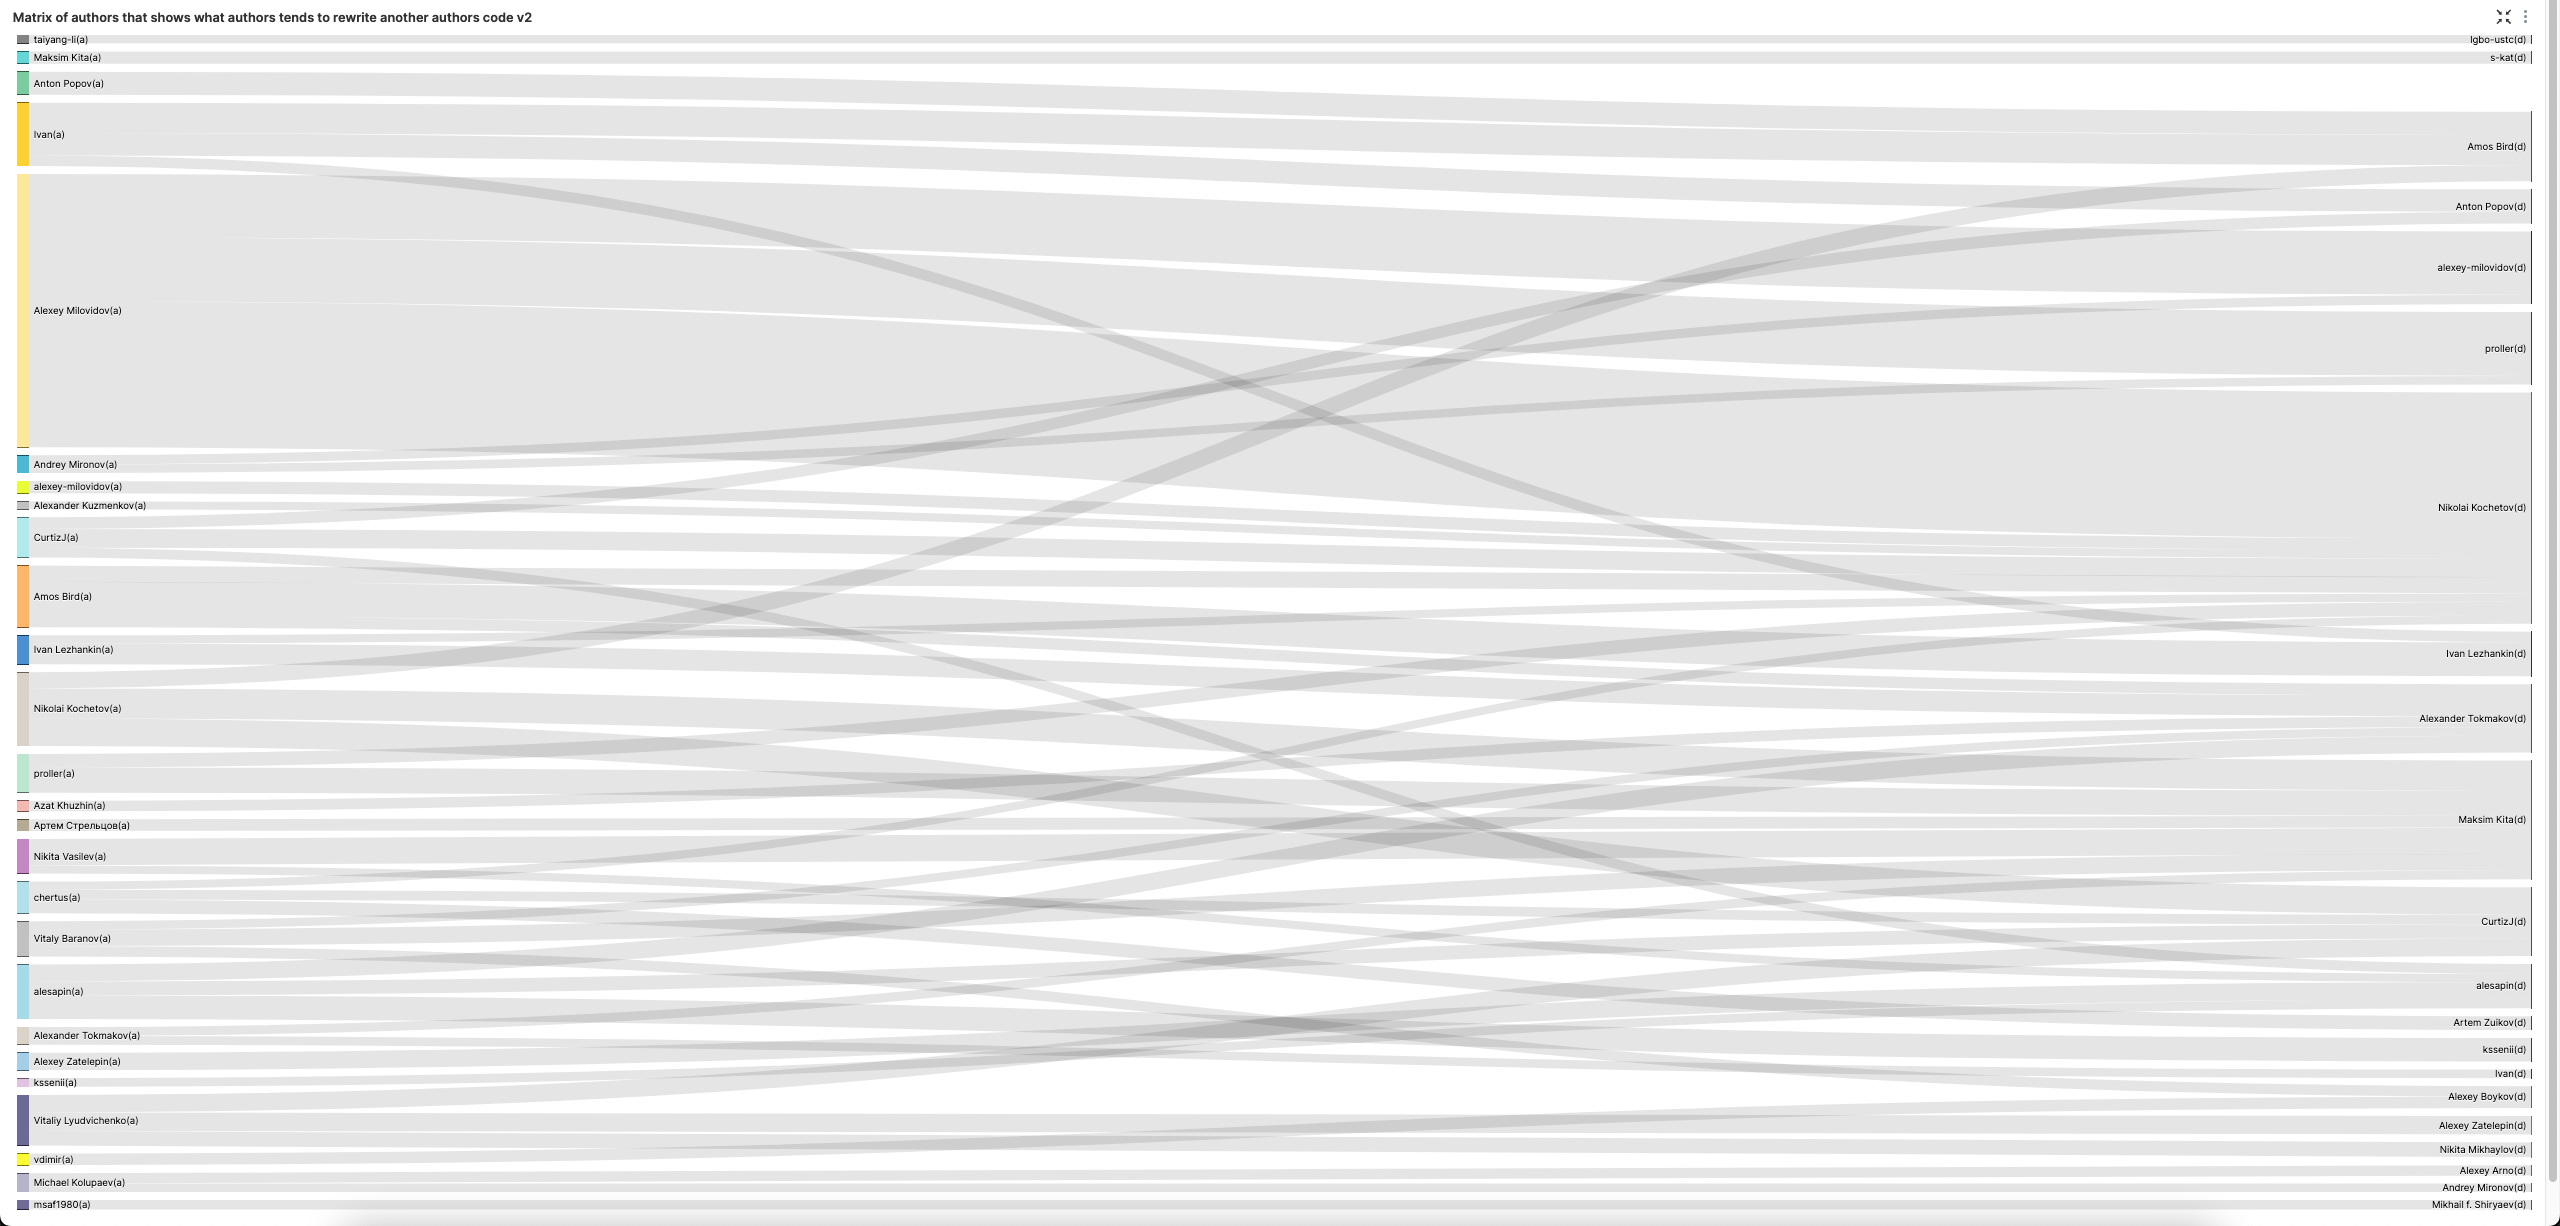
A Sankey chart (SuperSet) allows this to be visualized nicely. Note we increase our LIMIT BY to 3, to get the top 3 code removers for each author, to improve the variety in the visual.
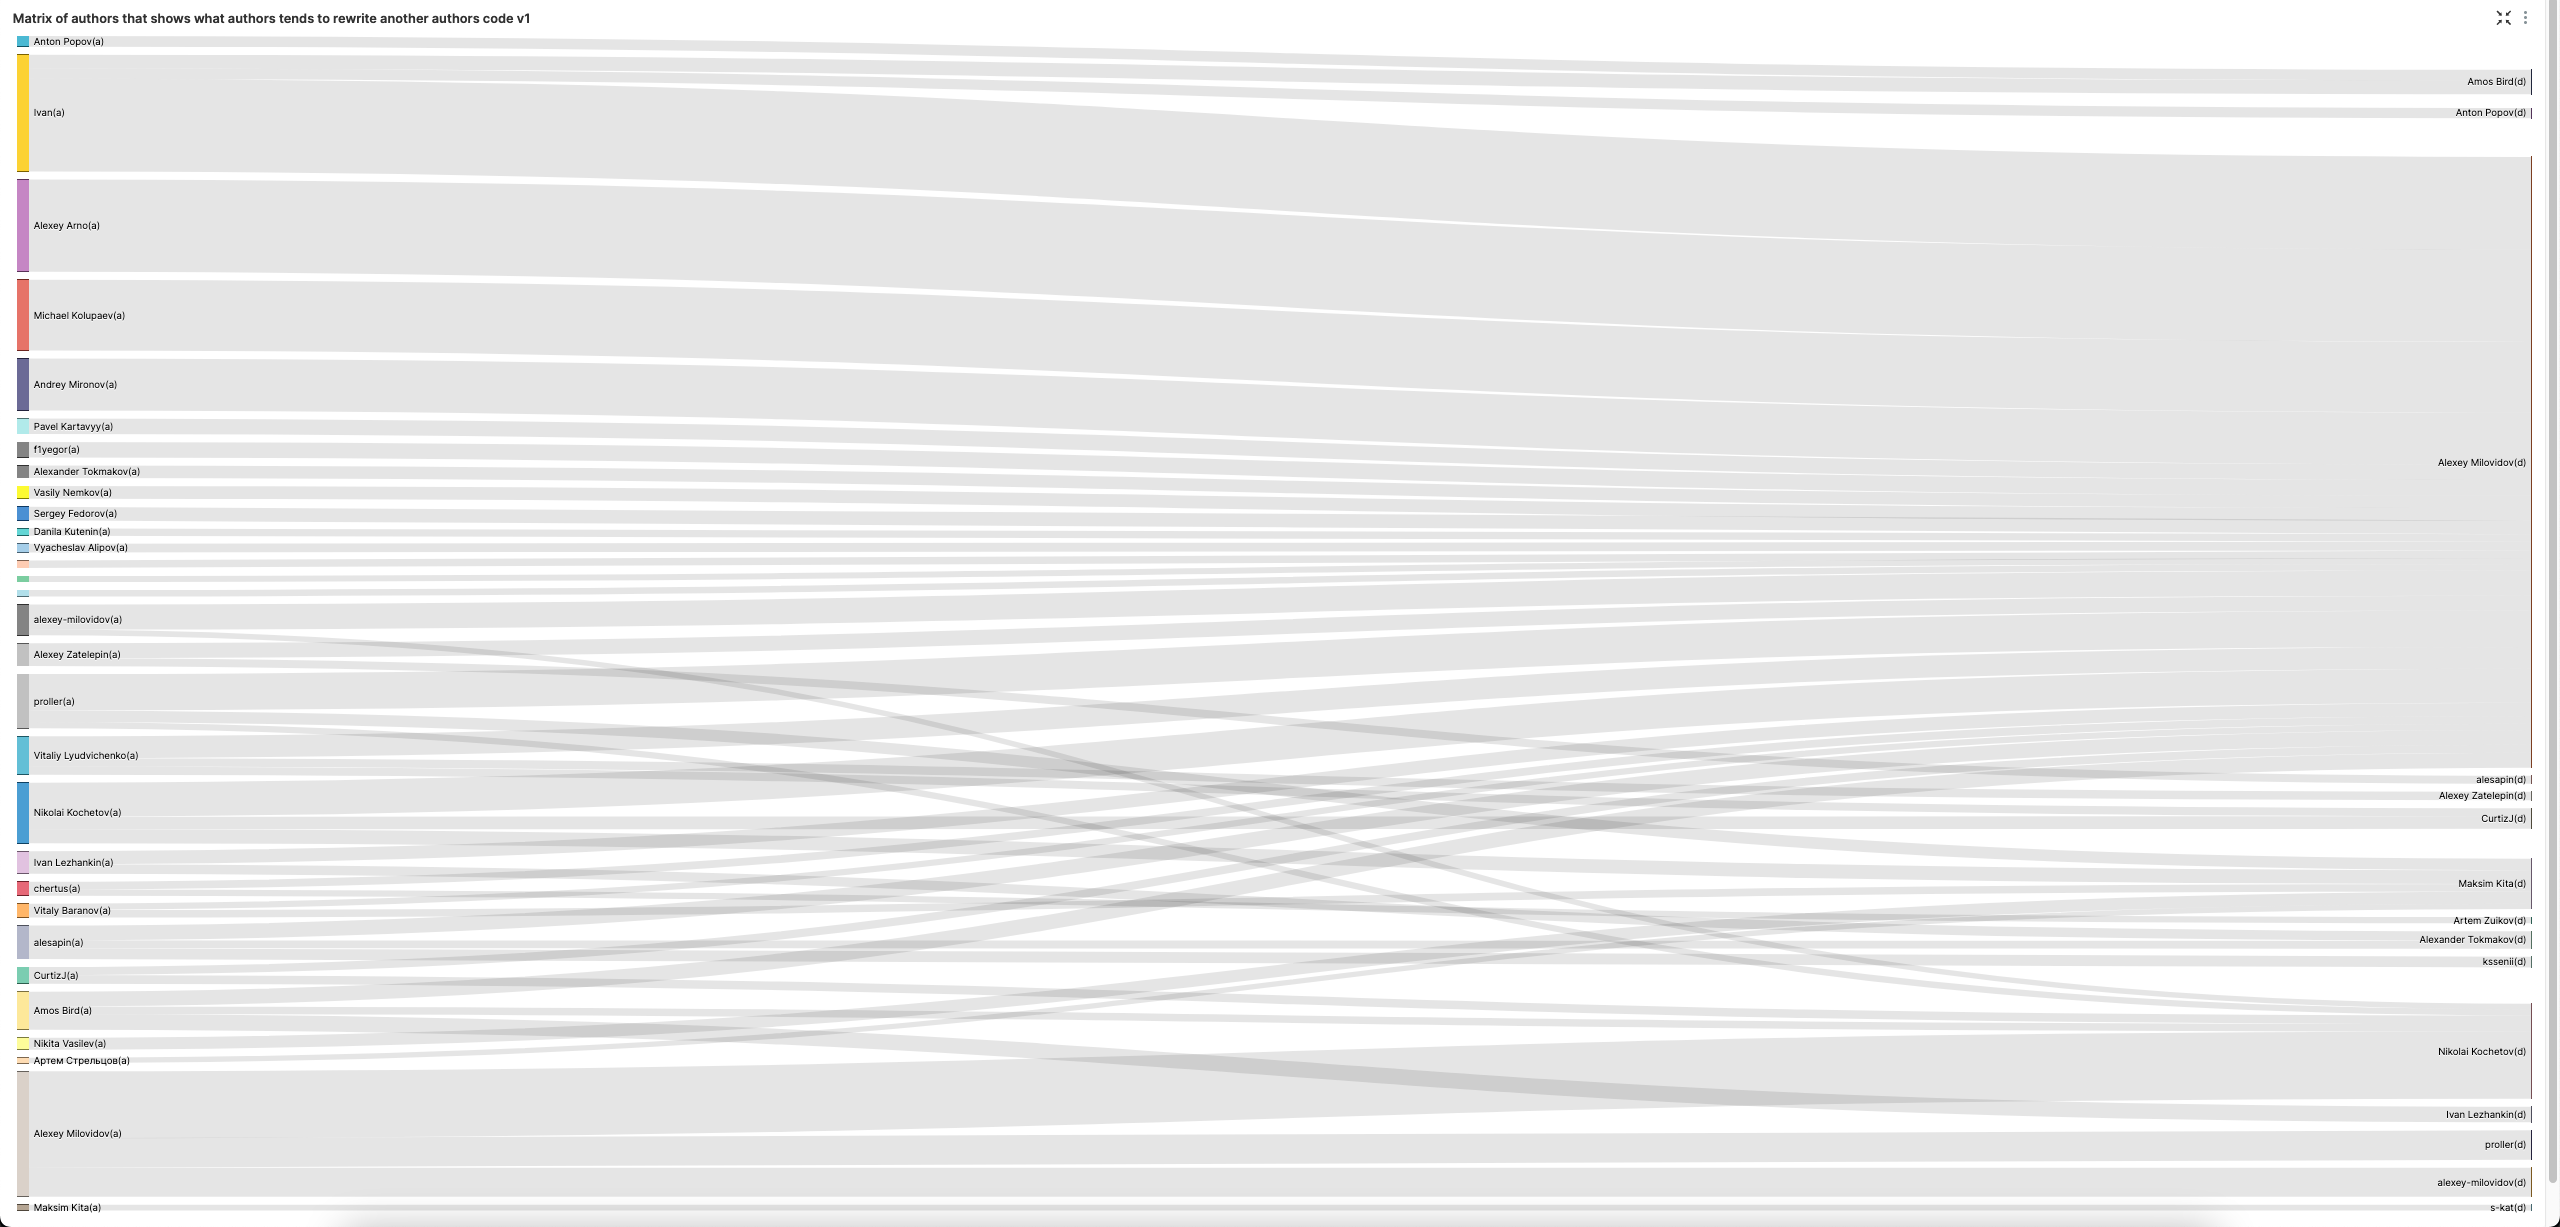
Alexey clearly likes removing other peoples code. Lets exclude him for a more balanced view of code removal.
Who is the highest percentage contributor per day of week?
If we consider by just number of commits:
OK, some possible advantages here to the longest contributor - our founder Alexey. Lets limit our analysis to the last year.
This is still a little simple and doesn't reflect people's work.
A better metric might be who is the top contributor each day as a fraction of the total work performed in the last year. Note that we treat the deletion and adding code equally.
Distribution of code age across repository
We limit the analysis to the current files. For brevity, we restrict the results to a depth of 2 with 5 files per root folder. Adjust as required.
What percentage of code for an author has been removed by other authors?
For this question, we need the number of lines written by an author divided by the total number of lines they have had removed by another contributor.
List files that were rewritten most number of times?
The simplest approach to this question might be to simply count the most number of line modifications per path (restricted to current files) e.g.:
This doesn't capture the notion of a "re-write" however, where a large portion of the file changes in any commit. This requires a more complex query. If we consider a rewrite to be when over 50% of the file are deleted, and 50% added. You can adjust the query to your own interpretation of what constitutes this.
The query is limited to the current files only. We list all file changes by grouping by path and commit_hash, returning the number of lines added and removed. Using a window function, we estimate the file's total size at any moment in time by performing a cumulative sum and estimating the impact of any change on file size as lines added - lines removed. Using this statistic, we can calculate the percentage of the file that has been added or removed for each change. Finally, we count the number of file changes that constitute a rewrite per file i.e. (percent_add >= 0.5) AND (percent_delete >= 0.5) AND current_size > 50. Note we require files to be more than 50 lines to avoid early contributions to a file being counted as a rewrite. This also avoids a bias to very small files, which may be more likely to be rewritten.
What weekday does the code have the highest chance to stay in the repository?
For this, we need to identify a line of code uniquely. We estimate this(as the same line may appear multiple times in a file) using the path and line contents.
We query for lines added, joining this with the lines removed - filtering to cases where the latter occurs more recently than the former. This gives us the deleted lines from which we can compute the time between these two events.
Finally, we aggregate across this dataset to compute the average number of days lines stay in the repository by the day of the week.
Files sorted by average code age
This query uses the same principle as What weekday does the code have the highest chance to stay in the repository - by aiming to uniquely identify a line of code using the path and line contents. This allows us to identify the time between when a line was added and removed. We filter to current files and code only, however, and average the time for each file across lines.
Who tends to write more tests / CPP code / comments?
There are a few ways we can address this question. Focusing on the code to test ratio, this query is relatively simple - count the number of contributions to folders containing tests and compute the ratio to total contributions.
Note we limit to users with more than 20 changes to focus on regular committers and avoid a bias to one-off contributions.
We can plot this distribution as a histogram.
Most contributors write more code than tests, as you'd expect.
What about who adds the most comments when contributing code?
Note we sort by code contributions. Surprisingly high % for all our largest contributors and part of what makes our code so readable.
How does an authors commits change over time with respect to code/comments percentage?
To compute this by author is trivial,
Ideally, however, we want to see how this changes in aggregate across all authors from the first day they start committing. Do they slowly reduce the number of comments they write?
To compute this, we first work out each author's comments ratio over time - similar to Who tends to write more tests / CPP code / comments?. This is joined against each author's start date, allowing us to calculate the comment ratio by week offset.
After calculating the average by-week offset across all authors, we sample these results by selecting every 10th week.
Encouragingly, our comment % is pretty constant and doesn't degrade the longer authors contribute.
What is the average time before code will be rewritten and the median (half-life of code decay)?
We can use the same principle as List files that were rewritten most number of time or by most of authors to identify rewrites but consider all files. A window function is used to compute the time between rewrites for each file. From this, we can calculate an average and median across all files.
What is the worst time to write code in sense that the code has highest chance to be re-written?
Similar to What is the average time before code will be rewritten and the median (half-life of code decay)? and List files that were rewritten most number of time or by most of authors, except we aggregate by day of week. Adjust as required e.g. month of year.
Which authors code is the most sticky?
We define "sticky" as how long does an author's code stay before its rewritten. Similar to the previous question What is the average time before code will be rewritten and the median (half-life of code decay)? - using the same metric for rewrites i.e. 50% additions and 50% deletions to the file. We compute the average rewrite time per author and only consider contributors with more than two files.
Most consecutive days of commits by an author
This query first requires us to calculate the days when an author has committed. Using a window function, partitioning by author, we can compute the days between their commits. For each commit, if the time since the last commit was 1 day we mark it as consecutive (1) and 0 otherwise - storing this result in consecutive_day.
Our subsequent array functions compute each author's longest sequence of consecutive ones. First, the groupArray function is used to collate all consecutive_day values for an author. This array of 1s and 0s, is then split on 0 values into subarrays. Finally, we calculate the longest subarray.
Line by line commit history of a file
Files can be renamed. When this occurs, we get a rename event, where the path column is set to the new path of the file and the old_path represents the previous location e.g.
This makes viewing the full history of a file challenging since we don't have a single value connecting all line or file changes.
To address this, we can use User Defined Functions (UDFs). These cannot, currently, be recursive, so to identify the history of a file we must define a series of UDFs which call each other explicitly.
This means we can only track renames to a maximum depth - the below example is 5 deep. It is unlikely a file will be renamed more times than this, so for now, this is sufficient.
By calling file_path_history('src/Storages/StorageReplicatedMergeTree.cpp') we recurse through the rename history, with each function calling the next level with the old_path. The results are combined using arrayConcat.
For example,
We can use this capability to now assemble the commits for the entire history of a file. In this example, we show one commit for each of the path values.
Unsolved Questions
Git blame
This is particularly difficult to get an exact result due to the inability to currently keep state in array functions. This will be possible with an arrayFold or arrayReduce, which allows state to be held on each iteration.
An approximate solution, sufficient for a high-level analysis, may look something like this:
We welcome exact and improved solutions here.